
How to Look Up Onondaga County Jail Population Data
Onondaga County jail population data comes from several official sources, not a single live dashboard. Each source updates on its own schedule and covers a different slice of the question. A researcher who understands the source layers gets a more accurate picture than one who relies on a single number taken from context.
The primary local source is the Onondaga County Sheriff's Office. The Sheriff publishes annual reports at sheriff.ongov.net/annual-reports/, and those reports are the most authoritative place to find rated capacity, average daily population, and population breakdowns for both facilities. The Correction Department history page at sheriff.ongov.net/correction/history/ provides historical context for how the county's corrections system developed over time.
For state and national framing, the Bureau of Justice Statistics and the Vera Institute county incarceration trends tool both cover New York county jails. Those sources supply the comparisons that give a local figure meaning. They are clearly labeled as context and should not be cited as the county's certified daily count.
The Onondaga County Sheriff also hosts an incarcerated-individual lookup at sheriff.ongov.net/correction/lookup/, but that tool answers a custody question about one person, not a population question about the facility. Population data and individual name lookups are different tasks and use different tools. The Onondaga County inmate records page covers the name-lookup tools in detail.
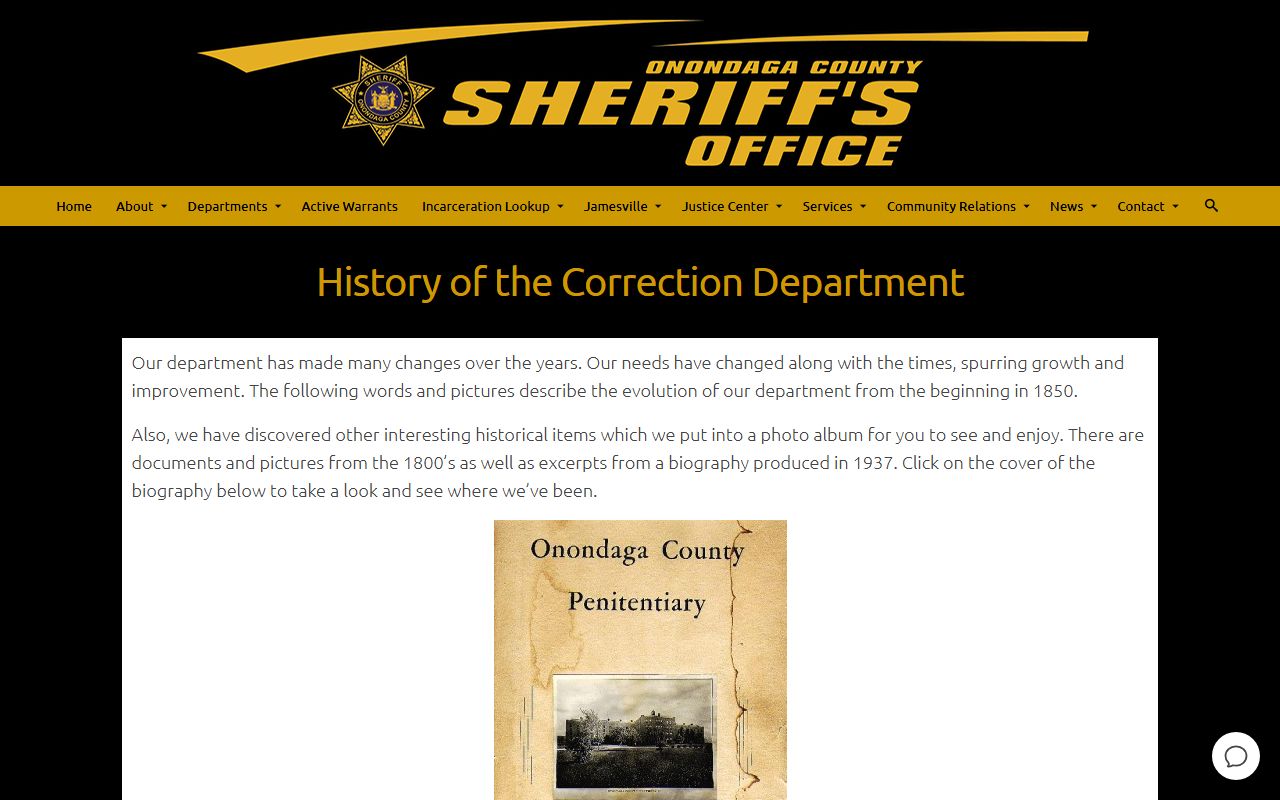
The Correction Department history page on the Sheriff's website documents how the county's custody operations developed, giving researchers a baseline for placing current population figures in a longer arc of institutional change.
Jail Capacity Overview: Two Onondaga County Facilities
Onondaga County operates two separate custody facilities. They serve different legal populations and should not be combined without care. Capacity and actual population are different numbers. Rated capacity is the approved housing limit set by the state. Actual population is the count on a given day or averaged over a reporting period. A facility can run below, at, or close to its rated capacity depending on arrest volume, bail practice, and transfer timing, and those conditions can shift from week to week.
The table below captures what official sources confirm for each facility. Specific rated capacity and average daily population figures were not published on the online Sheriff pages reviewed during the research pass. Those numbers should be pulled from the Sheriff's annual report or county budget documents. A researcher who needs the current verified figures should check the annual reports page or contact the Sheriff's Office directly.
| Facility | Address | Role | Rated Capacity | Avg Daily Population |
|---|---|---|---|---|
| Patrick J. Corbett Justice Center | 555 South State St, Syracuse, NY 13202 | Pretrial / county jail | Confirm in Sheriff annual report | Confirm in Sheriff annual report |
| Jamesville Correctional Facility | 6660 East Seneca Turnpike, Jamesville, NY 13078 | Sentenced local inmates | Confirm in Sheriff annual report | Confirm in Sheriff annual report |
The Justice Center sits in downtown Syracuse near the courthouse complex at 401 Montgomery Street and serves as the first stop after most county arrests. Jamesville is a separate campus outside the city and houses people serving local jail sentences after conviction. The Sheriff's Office manages both through its Correction Department. The incarcerated individual management page at sheriff.ongov.net/custody/inmate-management/ describes how the department handles classification, housing assignments, and supervision across both sites.
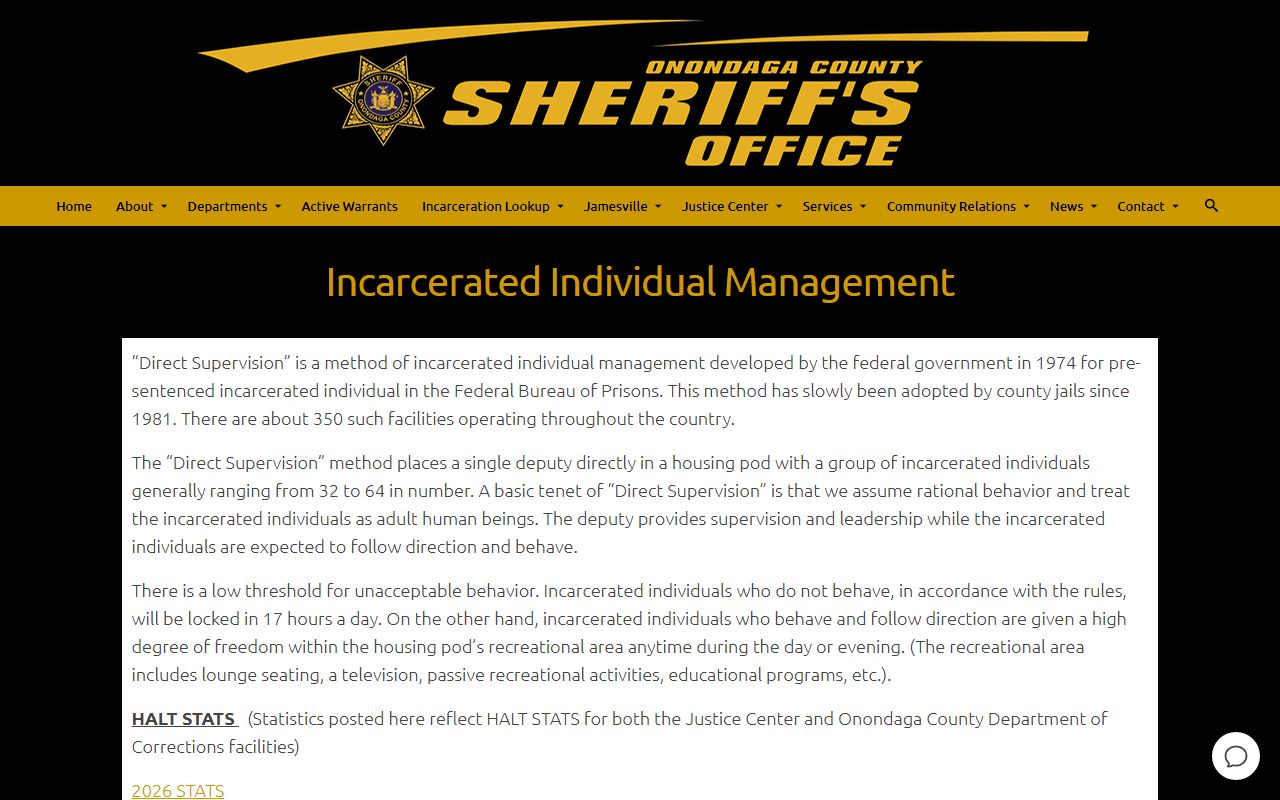
The incarcerated individual management page explains how the Sheriff's Correction Department handles intake, classification, and housing at the Justice Center and Jamesville, which directly shapes how the total population is distributed between the two facilities on any given day.
Average Daily Population
Average daily population, known as ADP, is the standard measure of how heavily a jail is used over time. A single-day count can be misleading. A busy Monday after a weekend arrest surge looks very different from a slow Thursday in the middle of a light court week. ADP smooths those swings into a number that shows the real load on the facility across a month or a year, and year-over-year ADP comparison is the most honest way to track change.
Several forces move Onondaga County's ADP up or down, and most have little to do with crime rates alone. Bail decisions are the biggest lever in the pretrial count. When more people can afford bail or are released on non-monetary conditions, the Justice Center count falls. Court backlogs push ADP up because people wait longer for their cases to resolve. The speed of case processing in Onondaga County Court, Syracuse City Court, and the town and village justice courts all feed into the number. Transfer timing for people headed to New York State DOCCS after a felony sentence also affects the county count during the gap between sentencing and transfer.
New York's bail reform changes in 2019 and subsequent amendments affected pretrial detention statewide. Whether Onondaga County's ADP tracked with or against the statewide direction should be confirmed with county-specific annual report data rather than assumed from the state average, because local arraignment volume, judicial practice, and charge mix all mediate the effect.
Note: ADP figures for the Justice Center and Jamesville are best sourced from the Sheriff's annual reports; the online pages reviewed during research did not publish a current ADP figure for either facility.
Pretrial vs Sentenced Population
A county jail holds two legally distinct groups, and the split between them is one of the most informative things a population figure can show. Pretrial detainees are people who have not yet been convicted. They are held because a court set bail they could not post, or because the court found release conditions could not adequately address the risk. Sentenced inmates are serving a local jail term after conviction, typically for a misdemeanor or a felony with a sentence of one year or less.
In Onondaga County, the two-facility structure makes this split more visible than in counties with a single building. The Justice Center primarily holds pretrial detainees and people newly arrested before arraignment. Jamesville Correctional Facility primarily holds sentenced inmates. Because the two facilities are physically separate, a shift in bail practice shows up quickly in Justice Center population counts, while sentencing trends show up in Jamesville's numbers. That separation is useful for researchers trying to understand whether population changes reflect pretrial or post-conviction dynamics.
| Group | Who They Are | Primary Facility | What Drives the Count |
|---|---|---|---|
| Pretrial detainees | Held before disposition; bail not posted or detention ordered. | Justice Center (555 S. State St, Syracuse) | Bail decisions, charge severity, court case speed. |
| Sentenced inmates | Serving a local jail term after conviction. | Jamesville Correctional Facility | Sentence length and local sentencing patterns. |
| Holds and detainers | Held for another agency or awaiting transfer to DOCCS. | Either facility | Warrants, parole holds, federal detainers, transfer queue. |
State prisoners under DOCCS supervision are not counted in the Onondaga County jail total. They may pass through briefly after sentencing while awaiting transfer to a state facility, but DOCCS tracks them separately from the county count. A researcher comparing Onondaga's county-jail population to a state prison population figure is comparing two different systems with different legal statuses and different funding structures.
Demographic Context
Demographic breakdowns of the Onondaga County jail population should come from official Sheriff reporting rather than from state or national estimates applied locally. The online Sheriff pages reviewed during the research pass did not publish a current demographic table for either the Justice Center or Jamesville Correctional Facility. Researchers who need the county breakdown should pull it from the Sheriff's annual report or file a FOIL request under New York's Freedom of Information Law, using the FOIL form at forms.ongov.net/foil-requests/.
For broader framing, the Bureau of Justice Statistics publishes national jail demographic data that covers race, gender, and age distributions across all U.S. jails. New York figures appear in BJS state-level tables. The Vera Institute's county incarceration trends tool adds time-series data showing how New York county jails changed over years. Both sources are clearly state or national context, not a substitute for Onondaga County's own published figures. A state rate applied to one county will be wrong more often than it is right.
What is documented nationally: men represent the large majority of the jail population in nearly every county. Women's share of the local jail population has grown over the past two decades, a trend visible in BJS annual data. Young adults and middle-aged adults make up most of the population. These national patterns inform what to look for in county reporting, but the Onondaga figures should come from the local source.
National and State Context
Reading an Onondaga County population number without a comparison point is like reading a single price without knowing the market. The federal and nonprofit context sources fill that role. They do not replace local data. They frame it so a researcher can judge whether a local figure looks typical or unusual.
The Bureau of Justice Statistics publishes annual jail population reports covering every U.S. county jail, including admissions, ADP, and incarceration rates per 100,000 residents; those national figures set the baseline that any county number should be read against.
The comparison below shows three levels a researcher needs to keep clearly separate. Blending them produces errors. A national rate applied as a local count, or a state average applied to one county, will mislead anyone who uses the figure downstream.
| Level | Source | What It Provides |
|---|---|---|
| County (Onondaga) | Sheriff annual reports; NY Commission of Correction | The actual local count, when published. Use for Onondaga-specific figures only. |
| State (New York) | Vera Institute county incarceration trends | How New York jails compare to each other and to the national rate per 100,000. |
| National | Bureau of Justice Statistics | Baseline rate per 100,000 residents; national ADP and admissions trends. |
New York's jail incarceration rate per 100,000 residents has historically run below many other large states, partly because New York's state prison system absorbs felony sentences that in other states stay at the county level. Onondaga County's position within New York should be read from county-level Vera Institute data, not assumed from the statewide average. A researcher comparing Onondaga to counties of similar size, similar urban character, and similar court volume gets a more useful comparison than one comparing it to small rural upstate counties with very different case mixes and demographic profiles.
Population Trends Over Time
A trend line tells more than a single number. A jail population that appears high for one month might reflect a court backlog that cleared the following month. A population that climbs steadily over three or four years reflects something structural in bail practice, case volume, or sentencing. Trend data is the difference between a headline and an explanation.
The Vera Institute's county incarceration trends database tracks admissions and population for Onondaga County going back years, making it one of the few public tools that shows local movement over time. The data is presented per 100,000 population, which removes the effect of Onondaga County's raw size and lets a researcher compare the county to others on an equal footing. The Vera tool draws on federal corrections data, so it may lag the current year by one or two reporting cycles.
Onondaga County's population trends have been shaped by forces documented at the state level. New York's bail law changes in 2019 reduced pretrial detention for many lower-level charges statewide. Later amendments in 2020 and 2022 adjusted which charges qualified. Whether those changes moved the Justice Center's pretrial count up or down in specific years is best confirmed from Sheriff annual report data. The county's role as the hub of the Fifth Judicial District means a heavier court case volume than most upstate counties, which affects the jail population in ways a rural comparison would not capture.
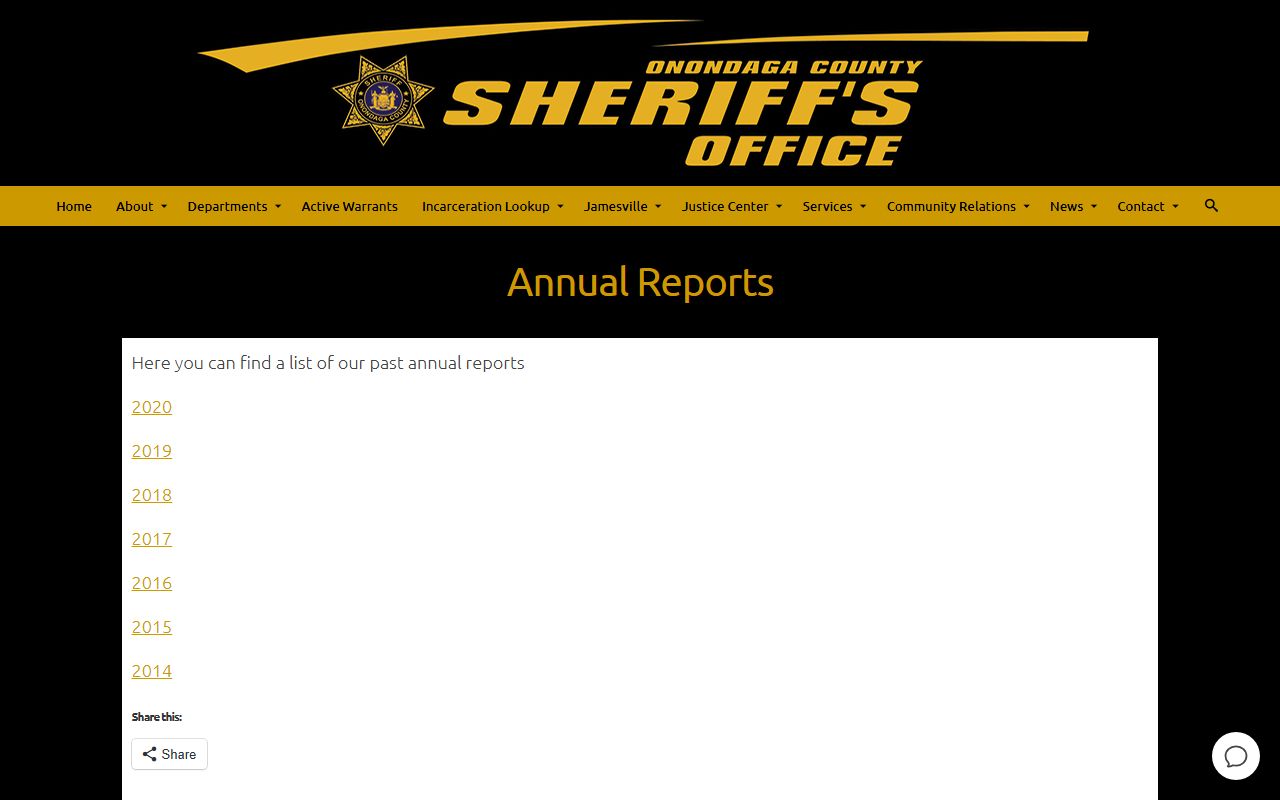
The Sheriff's annual reports archive holds the year-over-year figures that make trend comparison possible for Onondaga County; a researcher building a multi-year view should pull each available report rather than relying on a single year's snapshot alone.
The pandemic years brought population swings to nearly every U.S. county jail. Courts paused, some bail decisions shifted, and COVID protocols affected housing capacity. Onondaga County's pattern during those years should be read from county sources rather than inferred from national averages, because local court scheduling and the volume of new arrests in a mid-sized urban county produce a different trajectory than a national trend line would predict.
Searching for Inmate Records by Name
This page covers aggregate jail population data, not individual custody lookups. A person looking for one individual currently held by the Onondaga County Sheriff should use the Onondaga County inmate records page, which covers the Sheriff's Justice Center lookup at sheriff.ongov.net/lookup/, the Correction Department roster, VINELink custody notifications, the NY DOCCS state lookup, and the federal BOP locator. Population figures and name searches are separate tools built for different questions, and mixing the two produces confused results.
Where the Data Comes From
Keeping source labels clear is the most useful habit in corrections research. Onondaga County figures come from the Sheriff's Office annual reports and, for regulatory oversight, from New York State Commission of Correction reporting. Those are the only sources that carry the county's certified capacity and population numbers. State-level framing comes from the Vera Institute. National baseline figures come from the Bureau of Justice Statistics. Trend comparisons draw on both the Vera tool and BJS annual jail surveys.
The Correction Department of the Onondaga County Sheriff's Office manages both the Justice Center and Jamesville Correctional Facility. Its history, documented at sheriff.ongov.net/correction/history/, runs from earlier facility models to the current two-facility structure. Understanding that history helps explain why Onondaga County separates pretrial and sentenced populations across two buildings rather than consolidating all custody in one location. The operational and legal logic of that structure shapes the population figures a researcher will find in the annual reports.
Researchers using population data for policy, journalism, or legal work should confirm figures directly from the Sheriff's annual report and note the publication date of each figure. A number from a report two years old does not reflect today's population. Onondaga County's corrections system changes with each year's budget decisions, staffing levels, and the volume of cases moving through Onondaga County Court and Syracuse City Court.
Note: County-specific rated capacity, average daily population, and demographic breakdown figures were not confirmed in official online sources reviewed; pull them from the Sheriff's annual report or a FOIL request before citing them in any formal context.